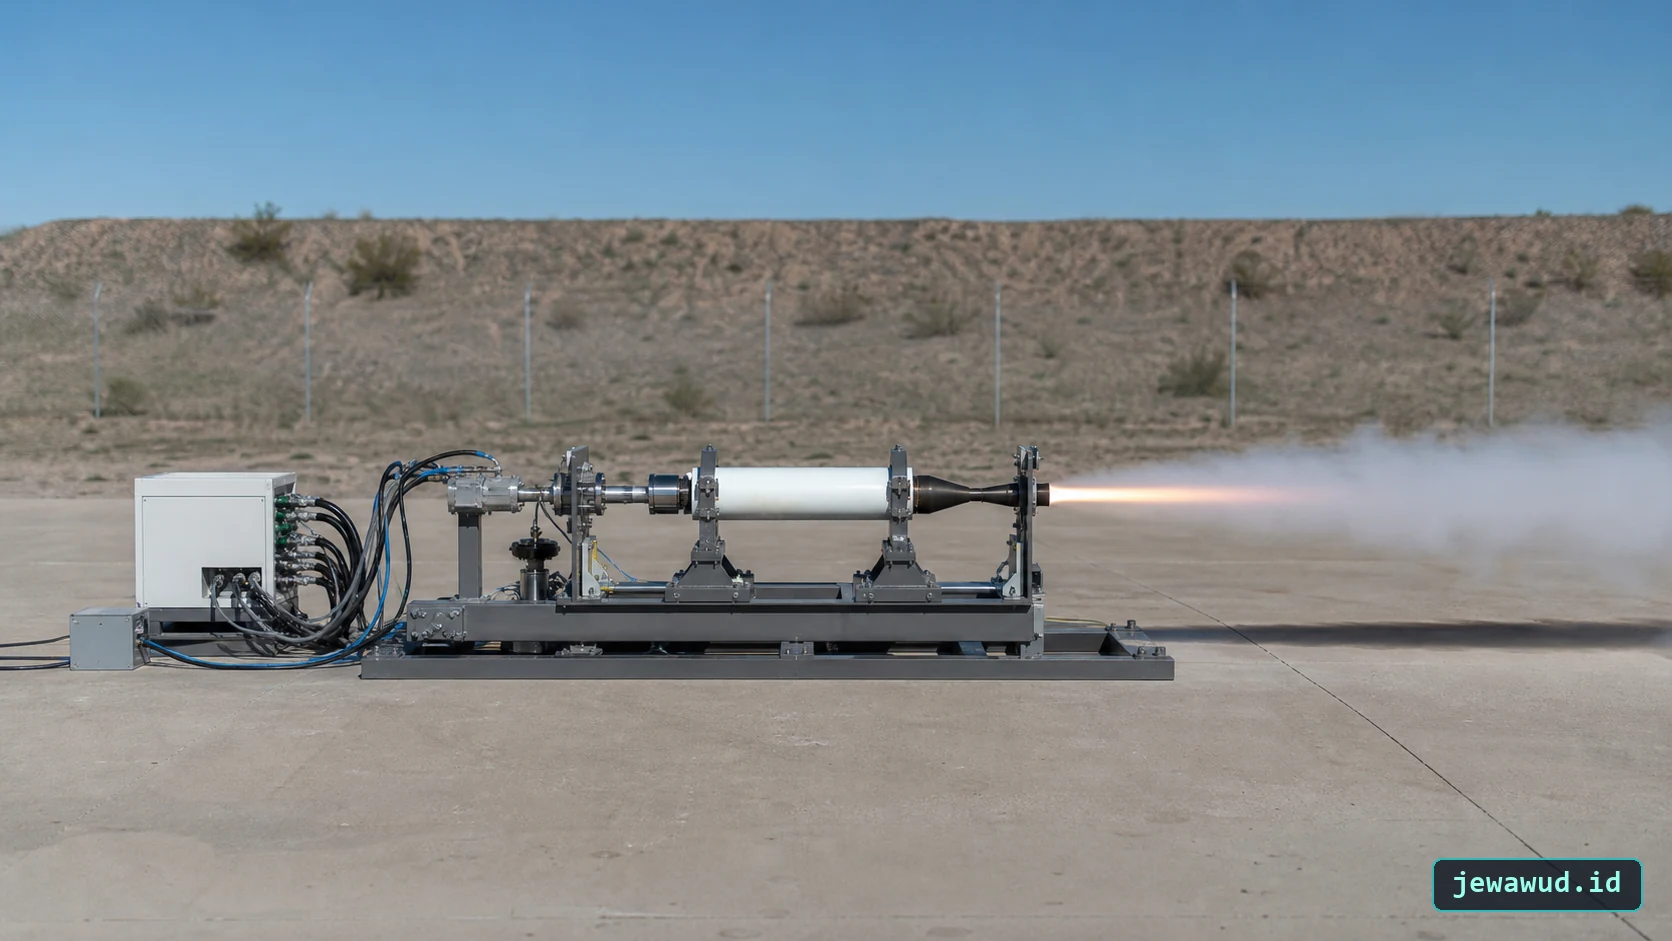
 An instrumented static firing converts motor force into a time history that can be inspected, integrated, and compared with a prediction
01What A Thrust Curve Actually Shows
A rocket thrust curve is a plot of motor thrust on the vertical axis against elapsed time on the horizontal axis. Each point answers a simple question: how much axial force was the motor producing at this instant? Read from left to right, the trace turns one firing into a compact performance history.
The graph is more informative than a single advertised number. It reveals whether thrust builds quickly enough for the vehicle to accelerate along its launch guide, whether a brief peak could create a high structural load, whether the motor settles into a sustained plateau, and how sharply force disappears near burnout. Two motors can deliver similar total impulse while producing very different acceleration histories.
A measured curve normally comes from a static test in which the motor is restrained and its axial force is recorded by a load cell. A simulated curve is calculated from a model of propellant regression, chamber pressure, mass flow, and nozzle performance. Both are useful, but they answer different questions: the model predicts behavior under stated assumptions, while the test records what a particular firing and measurement system produced.
02Ignition Rise, Sustained Burn, And Tail-Off
The first significant rise is the ignition transient. Pressure and mass flow build as the igniter starts the exposed propellant surface and the chamber approaches its operating state. This interval may be very short, but it matters because initial thrust determines how quickly a rocket begins moving and how much speed it has when it leaves the launch guide.
The middle portion is the sustained burn. It may rise, remain approximately level, or decline depending on the changing burning surface, pressure response, nozzle throat, propellant behavior, and other losses. Peak thrust is simply the highest value anywhere in the trace; it may occur during the ignition transient or later in the burn.
Tail-off is the final decline toward zero force as useful propellant generation ends and chamber pressure collapses. Real traces can contain vibration, electrical noise, fixture dynamics, and baseline drift, so the reported start and end of burn depend on a stated data-reduction rule. Burn time is therefore not always the interval between the first and last nonzero sample.
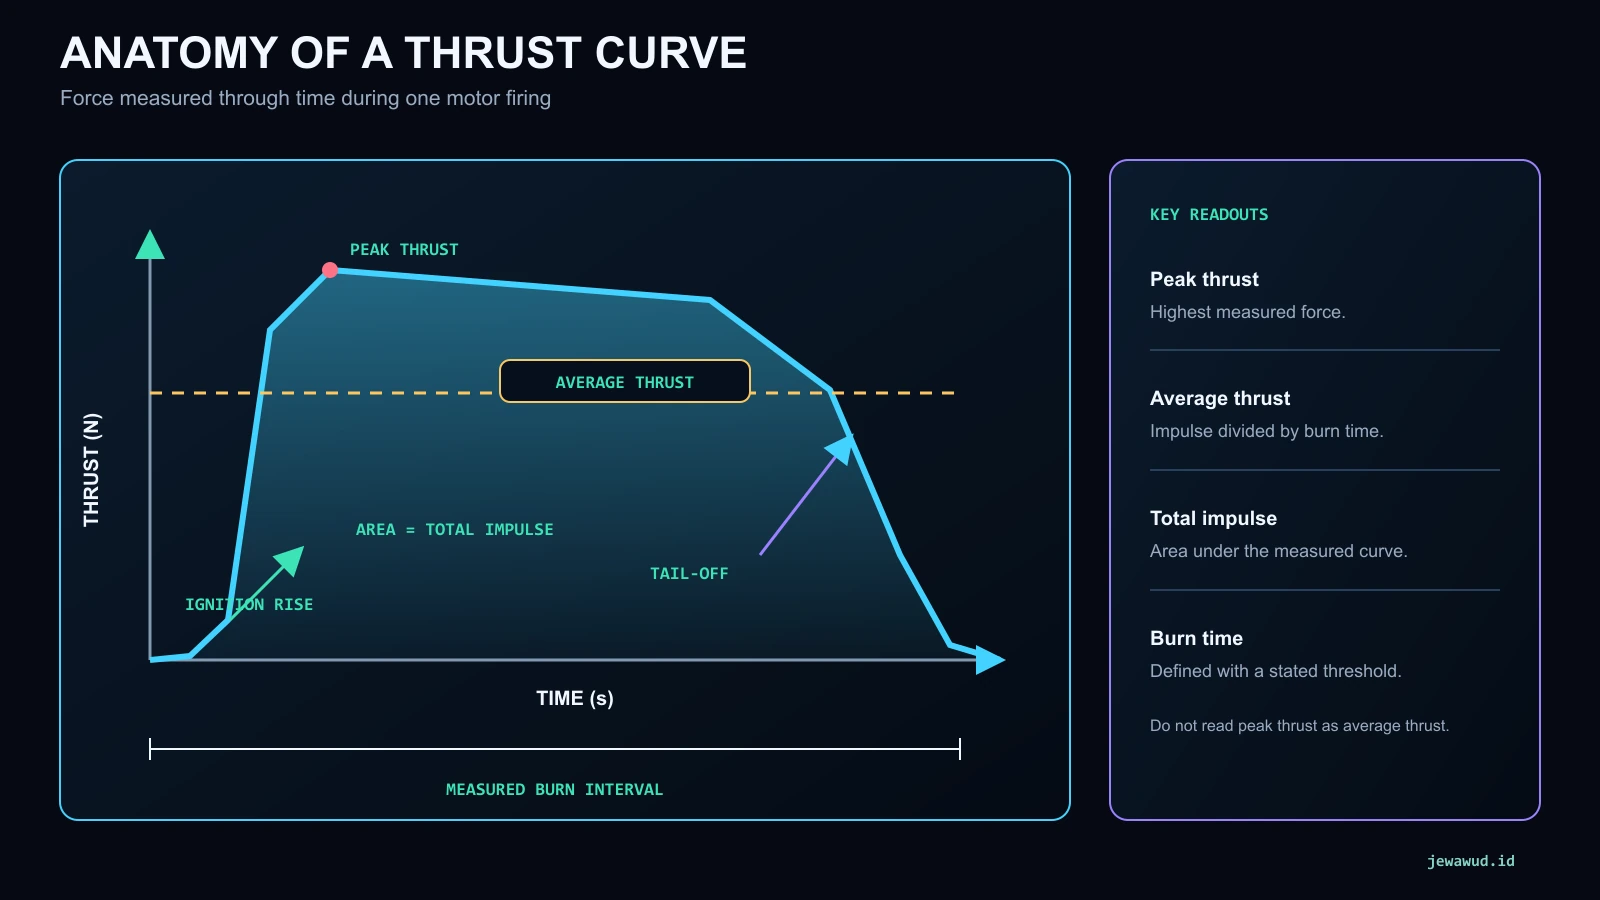 The force trace must be read as a complete history; peak thrust, average thrust, burn time, and total impulse describe different properties
03Total Impulse Is The Area Under The Curve
Total impulse, usually written It, is the integral of thrust over time: It = integral F(t) dt. Its SI unit is the newton-second. On the graph, it is the complete area between the measured thrust trace and the zero-force baseline during the firing.
If thrust were perfectly constant, total impulse would reduce to force multiplied by burn time. Real motor thrust varies, so software normally integrates the sampled curve numerically. With evenly spaced samples, this can be approximated by adding the areas of narrow trapezoids between successive measurements. The result depends on correct force calibration, time spacing, baseline removal, and the selected integration interval.
Average thrust is then Favg = It / tb, where tb is the defined burn time. Average thrust is not usually the midpoint between peak and minimum values. It is an area-preserving constant: a rectangle at the average-thrust level, extending across the same burn interval, has the same area as the actual curve.
Total impulse should not be confused with specific impulse. Total impulse measures accumulated push. Specific impulse normalizes delivered impulse by propellant weight flow or propellant reference weight and is used as a propulsion-efficiency metric.
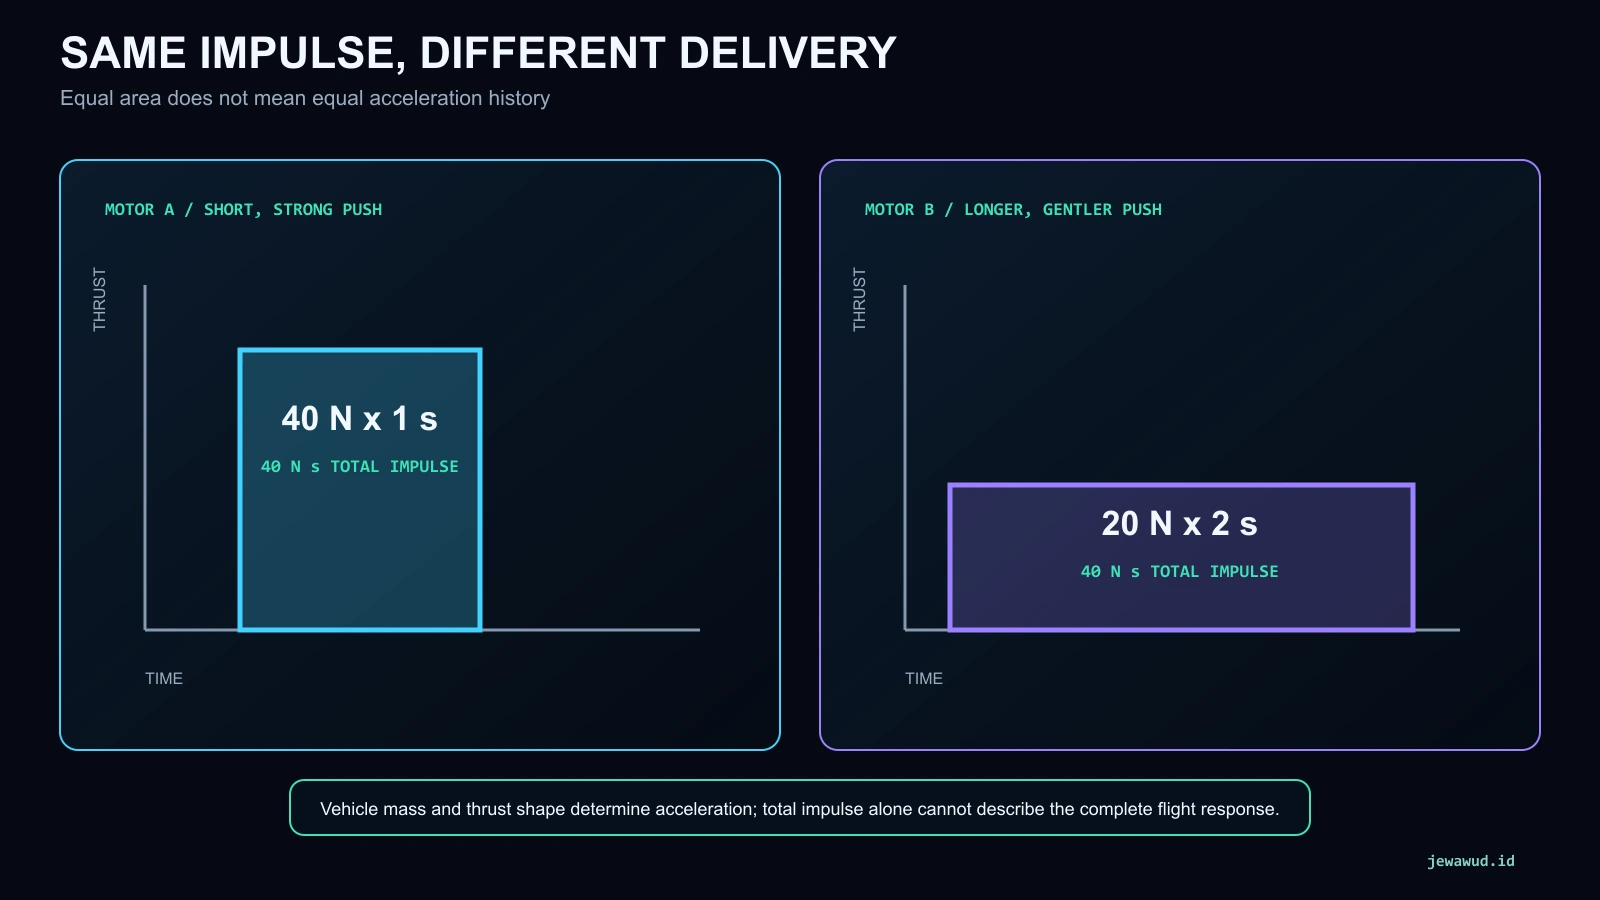 Equal idealized area means equal total impulse, but the shorter stronger burn produces a different acceleration and loading history
04Why Peak And Average Thrust Both Matter
Peak thrust is important for structural and mechanical loads. Motor retention, airframe joints, launch hardware, and payloads experience the instantaneous force transmitted through the vehicle. A short spike may contribute little total impulse while still creating the highest load of the burn.
Average thrust is useful for broad comparisons and appears in many hobby motor designations, but it hides timing. A motor with a large early peak and a long low tail can have the same average as a flatter motor. The first may provide stronger initial acceleration; the second may sustain acceleration for longer. Neither is automatically better without the vehicle mass, drag, launch guide, recovery plan, and mission objective.
The curve should be combined with vehicle mass through Newton's second law. A simplified vertical force balance is m a = T - D - m g, where thrust T, drag D, mass m, and acceleration a all change during flight. Early in the launch, low speed keeps drag small but the rocket must overcome weight. Later, drag rises with air-relative speed while propellant consumption reduces mass. This is why a fixed average-thrust value cannot reproduce a time-resolved trajectory.
For the liftoff relationship between thrust and weight, continue with Thrust-to-Weight Ratio Explained. For how rising speed and atmospheric density combine into aerodynamic load, see Max Q Explained.
05Progressive, Neutral, And Regressive Profiles
Solid-motor thrust histories are often described as progressive, approximately neutral, or regressive. In a progressive profile, thrust tends to rise as the burn proceeds. In an approximately neutral profile, sustained thrust remains near a plateau. In a regressive profile, thrust falls after an early high region.
These names describe trends, not perfectly smooth mathematical shapes. Every real curve still has an ignition rise and tail-off, and local peaks may appear. The main sustained-burn trend is strongly influenced by how exposed propellant burning area changes as the surface regresses. Increasing area tends to increase gas generation; decreasing area tends to reduce it. Chamber pressure, burn-rate response, throat behavior, erosive effects, propellant temperature, and manufacturing variation can modify that simple picture.
Grain geometry is therefore used to tailor thrust history, but geometry cannot be evaluated in isolation. The coupled internal-ballistics problem links burning area, chamber pressure, mass generation, nozzle mass flow, and material limits. The article Solid Rocket Motor Design Explained provides the broader system context without treating one curve shape as universally desirable.
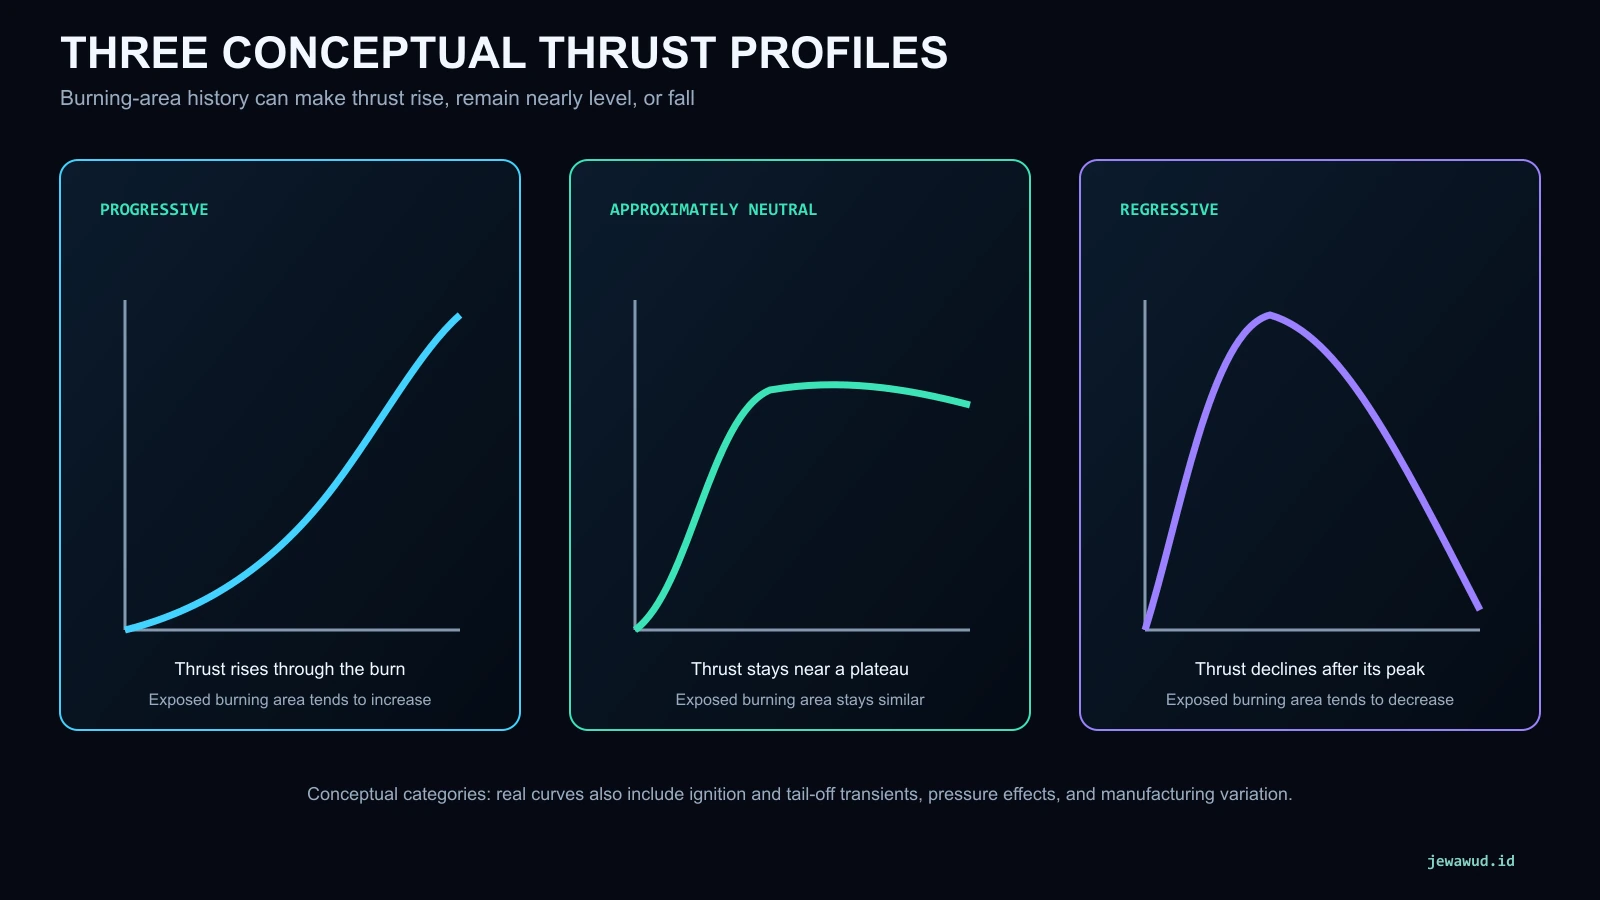 The categories describe sustained-burn trends; real test curves also include transients, noise, pressure effects, and firing-to-firing variation
06Reading A Motor Designation Without Guessing
Many model rocket motors use a three-part designation such as C6-4. Under the common NAR convention, the letter identifies the total-impulse class, the following number indicates nominal average thrust in newtons, and the final number indicates the nominal delay in seconds between motor burnout and initiation of the ejection charge for that motor variant.
The letter gives a range rather than the motor's exact measured impulse. Class C covers more than 5.00 up to 10.00 newton-seconds. A C motor can sit near either end of that interval. Likewise, the number 6 does not mean the motor produces a constant six newtons and does not reveal its peak force.
For engineering or flight planning, use the current certification sheet from the responsible testing organization or manufacturer. A certification sheet can provide measured total impulse, average thrust, peak thrust, burn time, delay performance, motor mass, and a representative thrust-time curve. Do not reconstruct the curve from the printed designation alone.
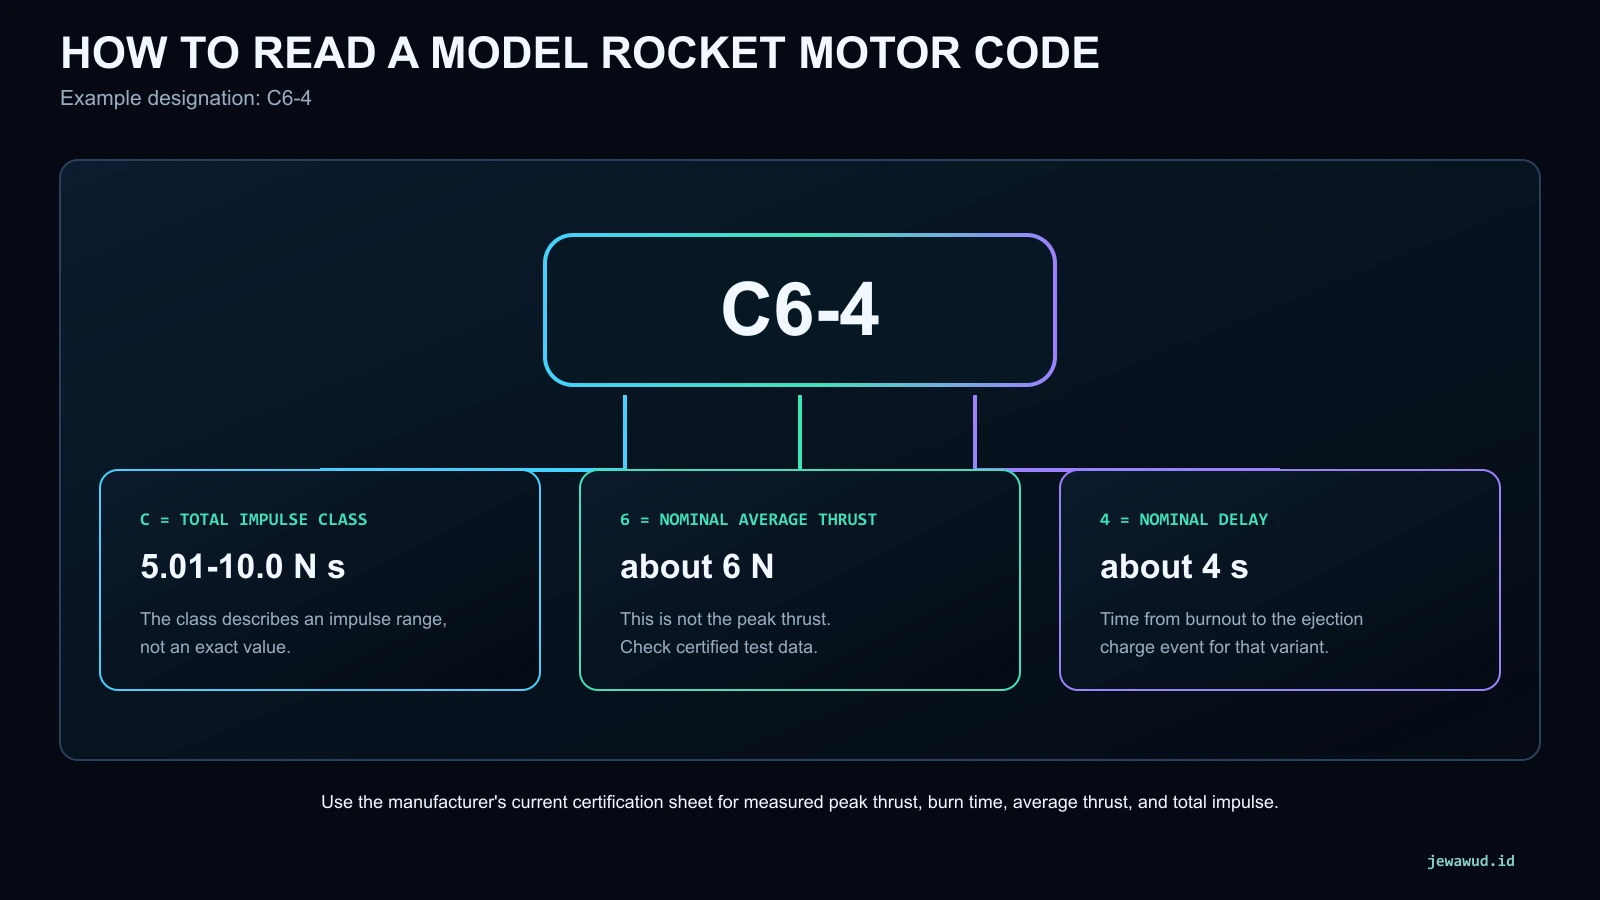 A motor code is a compact classification, not a substitute for its certified thrust-time data
07How A Static Test Becomes A Curve
In a static firing, the test fixture transfers axial motor force into a calibrated load cell. A data-acquisition system samples the sensor signal through time. The recorded channel is converted from voltage or digital counts into force using calibration data, then associated with the test clock and documented ambient conditions.
Good data reduction begins before ignition. The unloaded baseline is recorded, the measurement range is selected so the sensor does not saturate, and sample rate is chosen to capture the relevant transient behavior. After firing, analysts inspect zero offset, clipping, vibration, electrical interference, missing samples, and timing alignment. Filtering may improve readability, but excessive smoothing can erase a real ignition peak or change the integrated area.
The reported result needs definitions. State how ignition time, burnout, and burn duration were detected; whether thrust was corrected for baseline drift; which integration method was used; and whether the curve is raw, filtered, or averaged across repeated firings. A clean graph without this context can look authoritative while remaining difficult to reproduce.
A representative certification curve is not a promise that every manufactured motor will trace the exact same line. Propellant temperature, production tolerance, aging, instrumentation, and test conditions can produce variation. Flight analysis should use appropriate certified data and account for uncertainty rather than treating every pixel of one plotted curve as exact.
08Using Rocket Motor Designer Responsibly
The Jewawud Rocket Motor Designer lets users explore how a stated motor model produces predicted burning-area, pressure, thrust, and performance histories. Its most useful role is comparative: change one assumption, observe how the curve responds, and identify which output is sensitive to that change.
Begin by checking units and model assumptions. Review the whole predicted trace instead of chasing one attractive peak value. Compare peak thrust, average thrust, burn time, total impulse, chamber-pressure history, and mass evolution together. If one output improves while another moves toward an unacceptable region, the design has exposed a tradeoff rather than a free gain.
Simulation and test should form a loop. Predict the trend, collect calibrated evidence under qualified supervision, align the measured and simulated time histories, then investigate the residual difference. Possible causes include uncertain material properties, geometric tolerance, thermal state, loss models, sensor dynamics, or an incorrect boundary condition. Tuning a model to one firing without preserving physically defensible parameters may improve the picture while weakening its predictive value.
The app is an educational analysis environment. It does not certify hardware, prescribe manufacturing dimensions, or replace approved commercial motors, applicable regulations, qualified range safety, and professional engineering review.
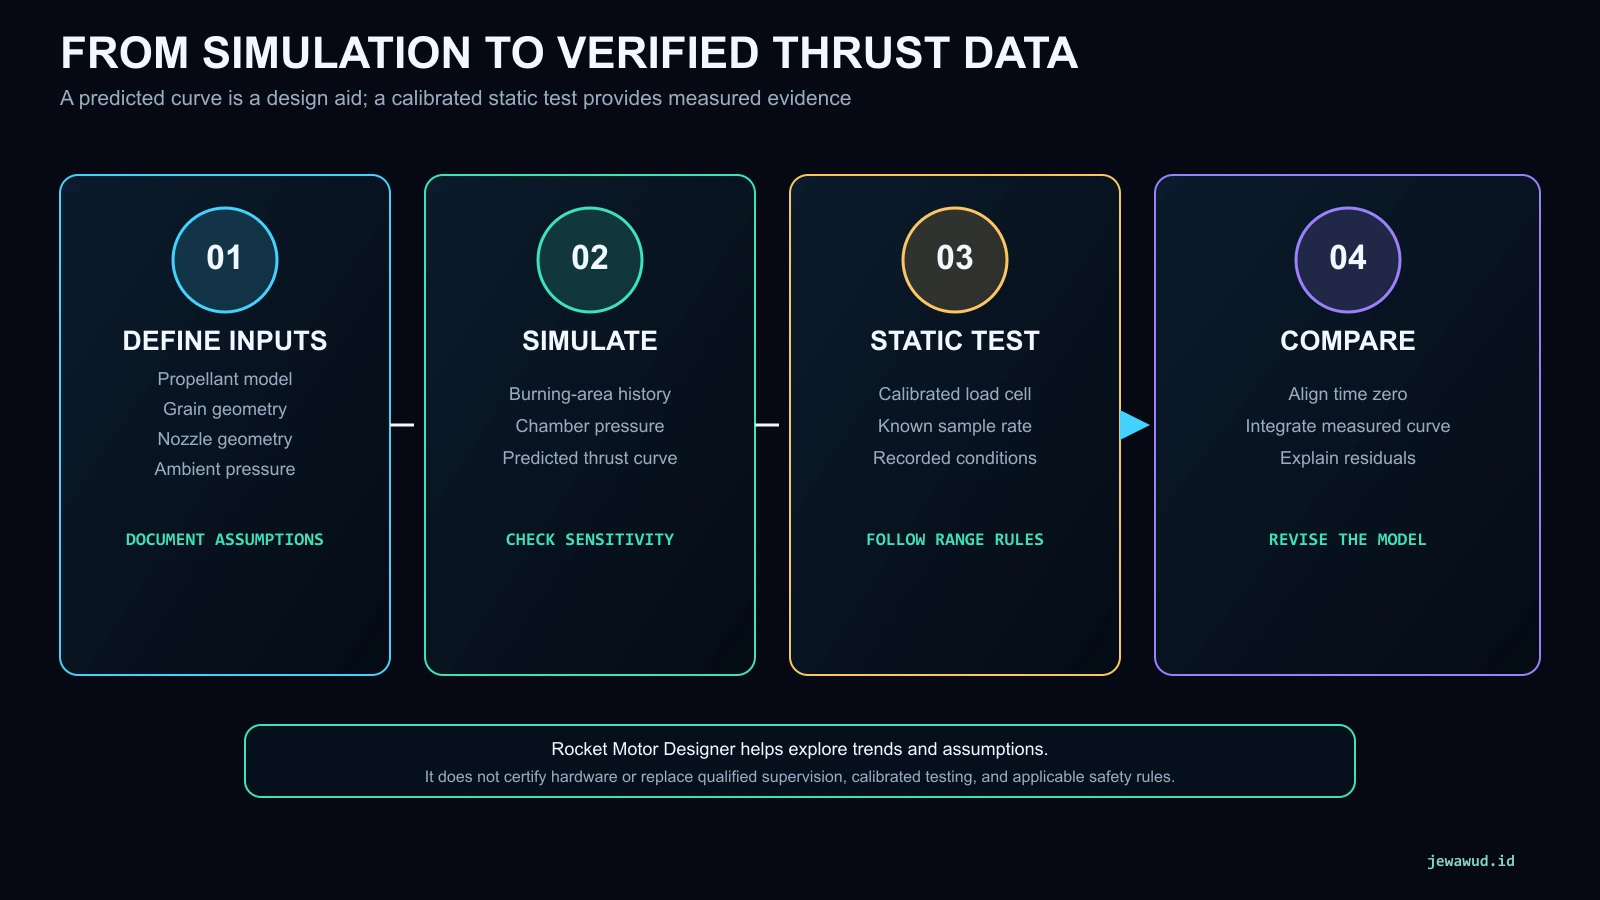 Use a prediction to frame a test, then use measured evidence to challenge and improve the assumptions behind the prediction
09Common Thrust-Curve Reading Mistakes
Treating peak thrust as continuous thrust. A peak may last only a small fraction of the burn. Use the complete trace for trajectory and load analysis.
Multiplying peak thrust by burn time. This overestimates impulse unless the motor truly remains at the peak. Integrate the measured curve or use validated total-impulse data.
Assuming the printed average defines the curve. Motors with the same average can have different ignition peaks, plateaus, and tail-offs. Use a certified thrust-time file when timing matters.
Comparing graphs with different scales. A visually taller curve may only use a tighter vertical axis. Compare units, axis limits, sampling, filtering, ambient condition, and the definition of burn time.
Ignoring the vehicle. The motor curve is an input, not the trajectory. Vehicle mass, drag, gravity, stability, launch-guide length, wind, and staging determine how that force becomes motion.
Calling simulation output measured data. Label predictions and tests clearly. A predicted curve inherits every model assumption; a measured curve inherits every instrumentation and processing choice.
10Primary References
The definitions and performance relationships in this article were checked against NASA propulsion education material, NASA technical literature, and National Association of Rocketry certification resources:
- NASA Glenn Research Center - Specific Impulse and Total Impulse
- NASA Glenn Research Center - Solid Rocket Engine
- NASA TM X-52393 - Exploring in Aerospace Rocketry: Solid-Propellant Rocket Systems
- National Association of Rocketry - Standards and Testing
- National Association of Rocketry - Rocket Motor Resources
The diagrams are explanatory and not test procedures or hardware drawings. Physical motor testing involves fire, pressure, energetic materials, noise, and debris hazards and must only be performed under applicable law, approved procedures, qualified supervision, and appropriate range safety controls.
Connect the curve with the motor system.
Use Rocket Motor Designer to compare predicted thrust history with pressure, burning area, mass flow, and total impulse, then return to the article to interpret what each metric actually means.
Open Rocket Motor Designer