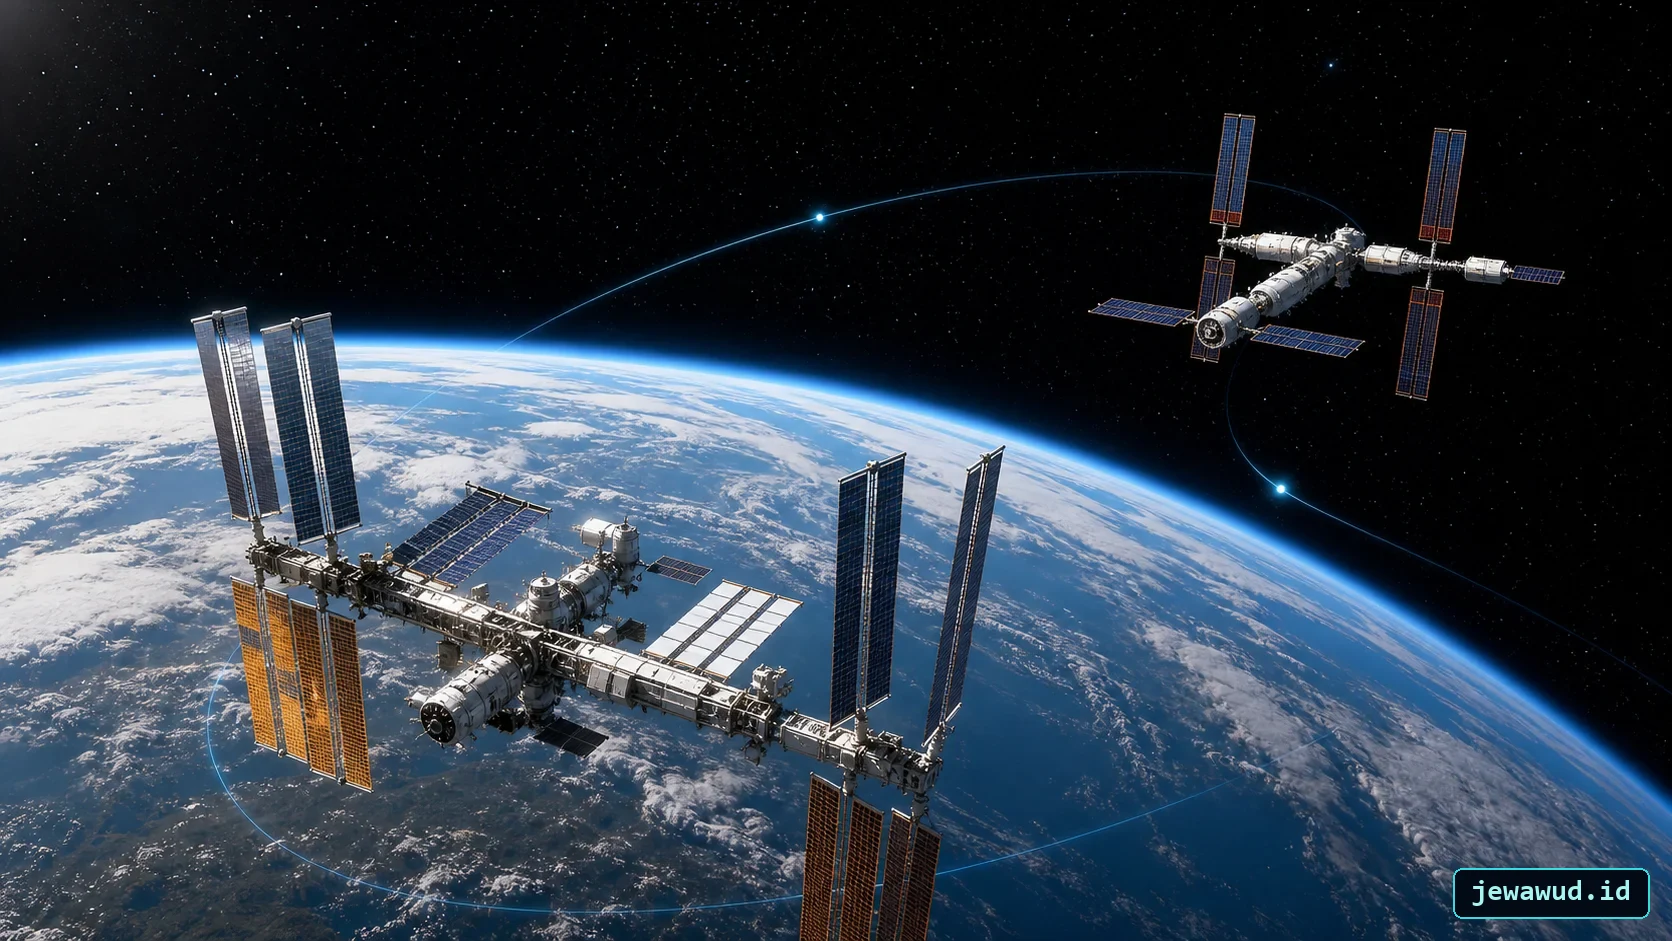
 Station tracking begins with orbit propagation, then becomes a live map
01Three Questions A Station Map Does Not Answer In The Same Way
“Where is the ISS?”, “Where should I look?” and “Will I see it?” require different calculations. The first asks for a position around Earth. The second asks for a direction relative to an observer. The third adds lighting and local viewing conditions.
JITM (Jewawud ISS Tiangong Monitor) is Jewawud's station-tracking application. Its orbital display helps identify where the stations are predicted to be. A marker alone is not a sighting forecast, a camera feed or a direct measurement of the station's position.
02Why The Dot Moves Between Data Updates
A public tracker can advance a position using an element set and the current time. SGP4 propagation produces a position and velocity in an inertial-style reference frame; a further conversion accounts for Earth rotation before plotting geographic coordinates. CelesTrak describes the model and its TEME output frame.
The sub-satellite point is the point beneath the spacecraft on Earth. A ground track joins these points over time. Inclination creates the north-south excursion, map projection changes its appearance, and Earth's rotation shifts successive passes in longitude. A break at a flat map's left or right edge is not a physical jump by the station.
The ISS catalog ID is 25544; the Tianhe-based Tiangong tracking record is 48274. Matching IDs and timestamps is more dependable than comparing decorative spacecraft models.
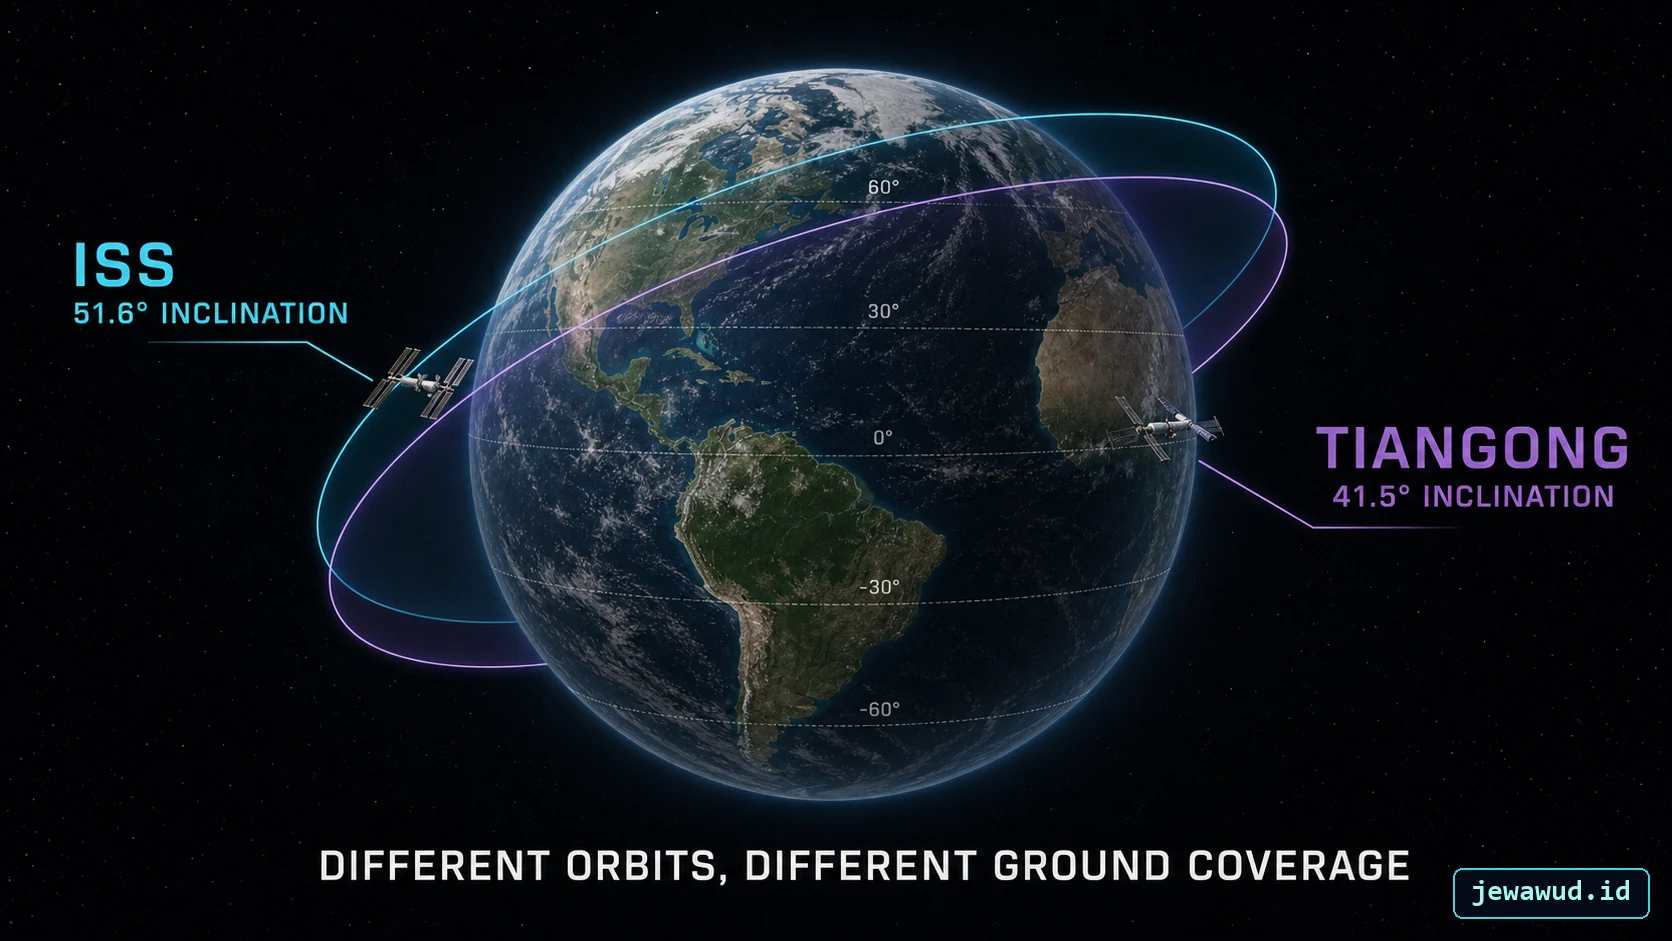 Different inclinations give ISS and Tiangong different latitude limits and ground-track patterns
03Inclination Limits The Ground Point, Not Every Possible Sighting
The ISS orbit is inclined approximately 51.6 degrees to the equator. In a spherical-Earth picture, its ground point therefore stays within approximately 51.6 degrees north and south. Geographic latitude on an ellipsoidal Earth introduces a small distinction. ESA's ISS specifications provide the nominal inclination.
That band is not a hard boundary for seeing the spacecraft. Observers can look sideways toward a station above another region. Compare Tiangong's inclination in its own record rather than assuming that every crewed station has the ISS ground-track limits.
04A Worked Example: The Station Need Not Be Over Your City
Take a simplified spherical Earth of radius 6,371 km and a station at an assumed 400 km altitude. These are example inputs, not live ISS measurements. A line of sight grazing the horizon forms a right triangle with Earth's centre and the spacecraft.
The central angle to that horizon is acos(6371 / 6771), approximately 19.8 degrees. Multiplying the angle in radians by Earth's radius gives about 2,200 km along the surface from the observer to the sub-satellite point.
This is an ideal zero-elevation geometric limit, not a useful visibility radius. Terrain, buildings and atmospheric extinction obstruct low views. Requiring a positive elevation angle reduces the reachable region; sunlight and sky brightness impose additional limits. The calculation explains how a station plotted over the ocean can still be above a coastal observer's horizon.
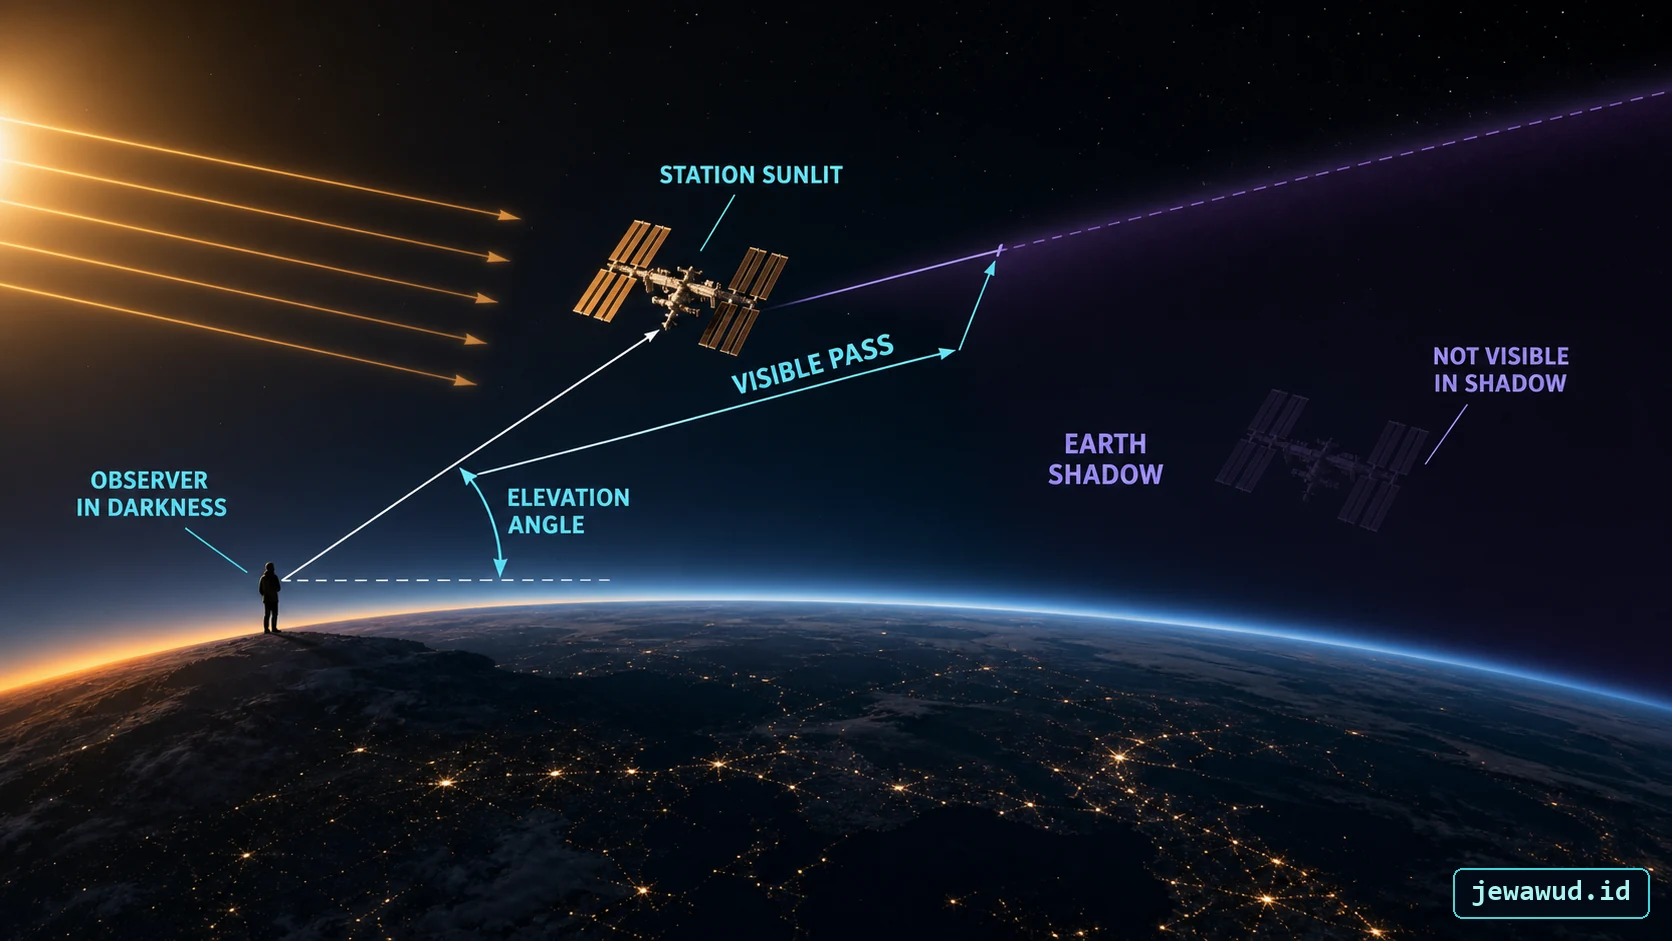 A useful visible pass needs favorable observer darkness, station illumination, and elevation geometry
05Read A Sighting Forecast As A Sky Direction
NASA's Spot the Station guide distinguishes start time, visible duration, maximum height, and appearance/disappearance directions. “Height” in that forecast means elevation angle above your horizon, not the station's altitude in kilometres.
For example, an illustrative forecast saying “appears 10 degrees above W; maximum elevation 60 degrees” tells you to start looking low in the western sky and follow the pass higher. It does not mean the station rises from 10 km to 60 km. Zero degrees is the horizon; 90 degrees is overhead.
The ISS is seen by reflected sunlight. The observer generally needs a dark enough sky while the station remains sunlit. A pass can end when the station enters Earth's shadow even though it is still above the horizon. Clouds and obstructions can spoil an otherwise favourable prediction.
06A Reboost Changes The Orbit Behind The Prediction
Atmospheric drag acts even at station altitude. ESA's 2016 reboost demonstration documents a concrete example: the reported orbit changed from 398.2 by 407.4 km to 402.1 by 406.9 km, and the listed period increased from 92.62 to 92.66 minutes.
Those are historical before-and-after values, not today's altitude. They show why a reboost is not just a visual “jump upward” on a map: it changes the subsequent timing as well as orbital height. A pre-burn element set cannot be assumed to capture the changed orbit. Refresh the source data before interpreting a disagreement as a rendering fault.
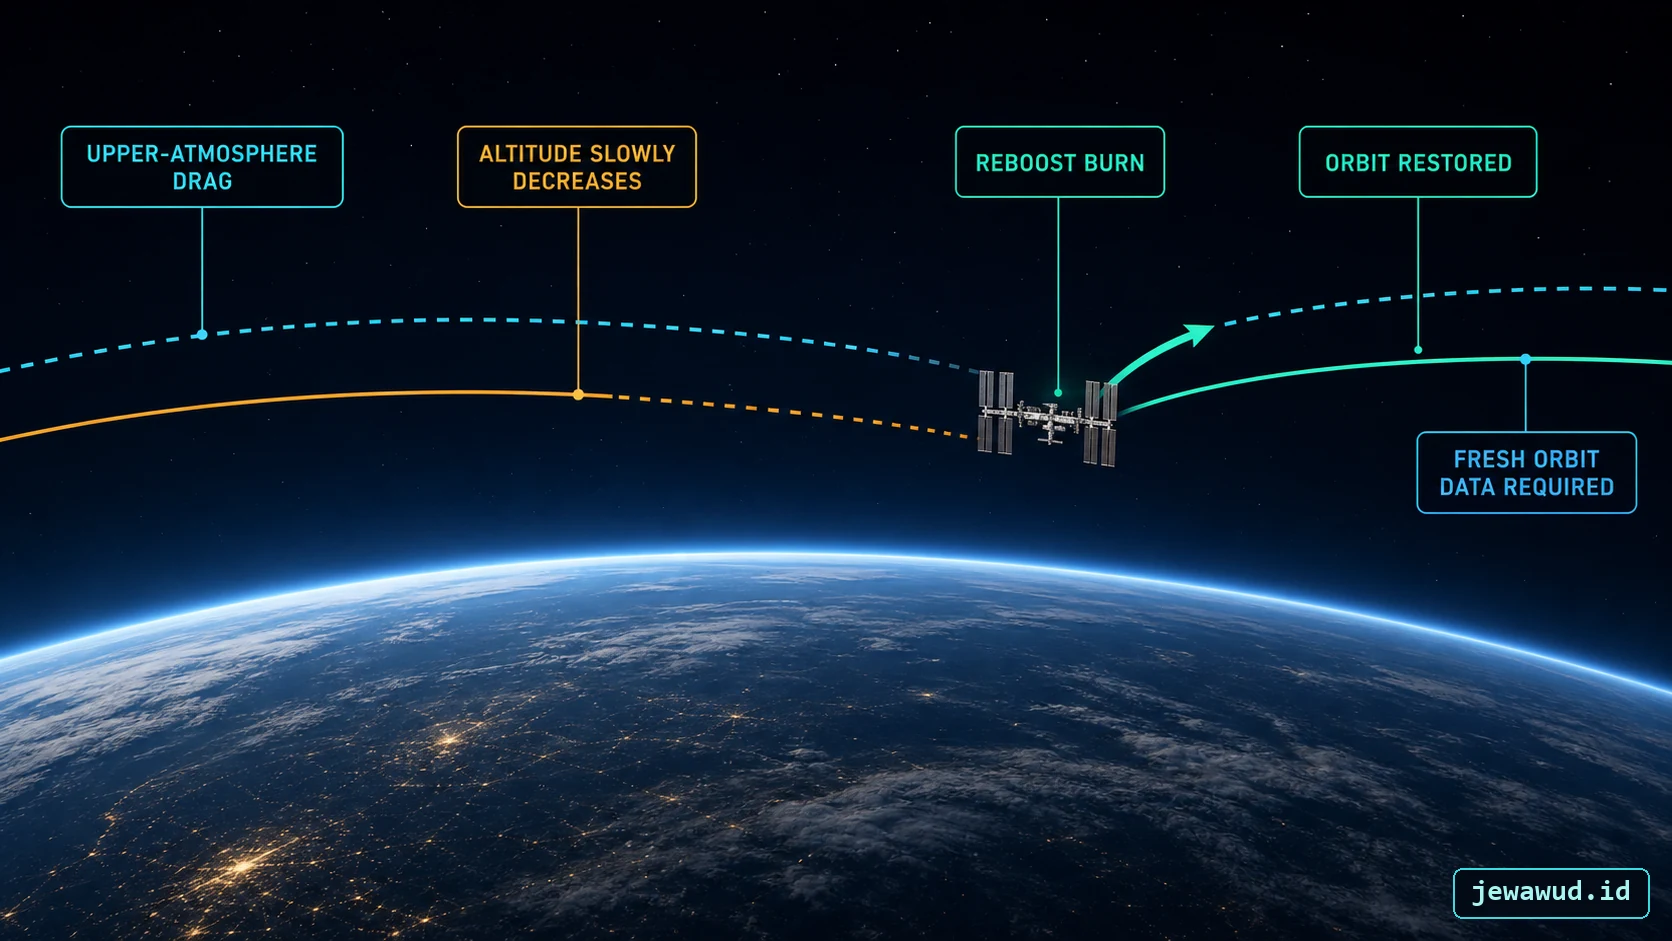 Drag slowly lowers the orbit; a reboost changes it and makes fresh orbital data necessary
07Compare The Two Stations Without Mixing The Clocks
Open JITM and select the ISS, then Tiangong. For each, record the station identity, displayed UTC time, altitude and position. Compare the inclination with its catalog record. Do not interpret a difference between the stations as a disagreement between two measurements of the same object.
For an Indonesian time example, 12:00 UTC is 19:00 WIB. Both labels refer to the same instant. A UTC screenshot and a local-time sighting forecast can agree even when their hour labels differ. Keep the calendar date as well, especially when a conversion crosses midnight.
If data fails to load, use the dated catalog snapshot only as historical context. Do not present a stored screenshot as a new live observation. This exercise compares displays and their timestamps; it is not independent tracking of the real spacecraft.
08Diagnose A Mismatch Before Trusting A Pass
Different locations on two maps: match the station ID, requested UTC time and element epoch. Also distinguish the station's position from an observer location pin.
The marker is right but the sky direction is wrong: check the observer coordinates and whether the displayed bearing uses true north or another reference. An overhead map is not a compass view from your location.
The pass is above the horizon but nothing is visible: check sunlight, local sky brightness, cloud and obstructions before blaming the orbit.
A new prediction differs after a maneuver: retain the source epochs when comparing results. A newly fitted orbit can legitimately change the answer. Read What Is TLE Data? for the difference between epoch, download time and display time.
Compare ISS And Tiangong
Read the station identity and timestamp before interpreting the moving map.
Open JITM Tracker